Australia's environment in 2016
Our objective is to make spatial information on environmental conditions easier and faster to access for interested users. Data on 13 environmental indicators are organised in 6 Themes: land cover, bushfire, water availability, rivers and wetlands, landscape health, and carbon storage. Information can be accessed through:
- Australia’s Environment Explorer allows users to visualise and interpret national-scale information on each indicator by region and land cover type. The information can be accessed as maps, environmental accounts or graphs. Data can be compared to preceding years or downloaded for further analysis.
- The Fact Sheet (pdf, 890 KB) concisely summarises the main changes in our environment during the previous calendar year.
- The briefing material (slides) illustrates the main findings using data from the website. Information for the current calendar year is planned for release in January next year.
Acknowledgments
Australia’s environment was developed by ANU’s Water and Landscape Dynamics group with seed funding from the Australian Research Council and the Bureau of Meteorology. It was made possible by collaboration with the National Computational Infrastructure, CSIRO, Bureau of Meteorology, Australian Bureau of Statistics, Geoscience Australia, TERN AusCover, NASA, and others.
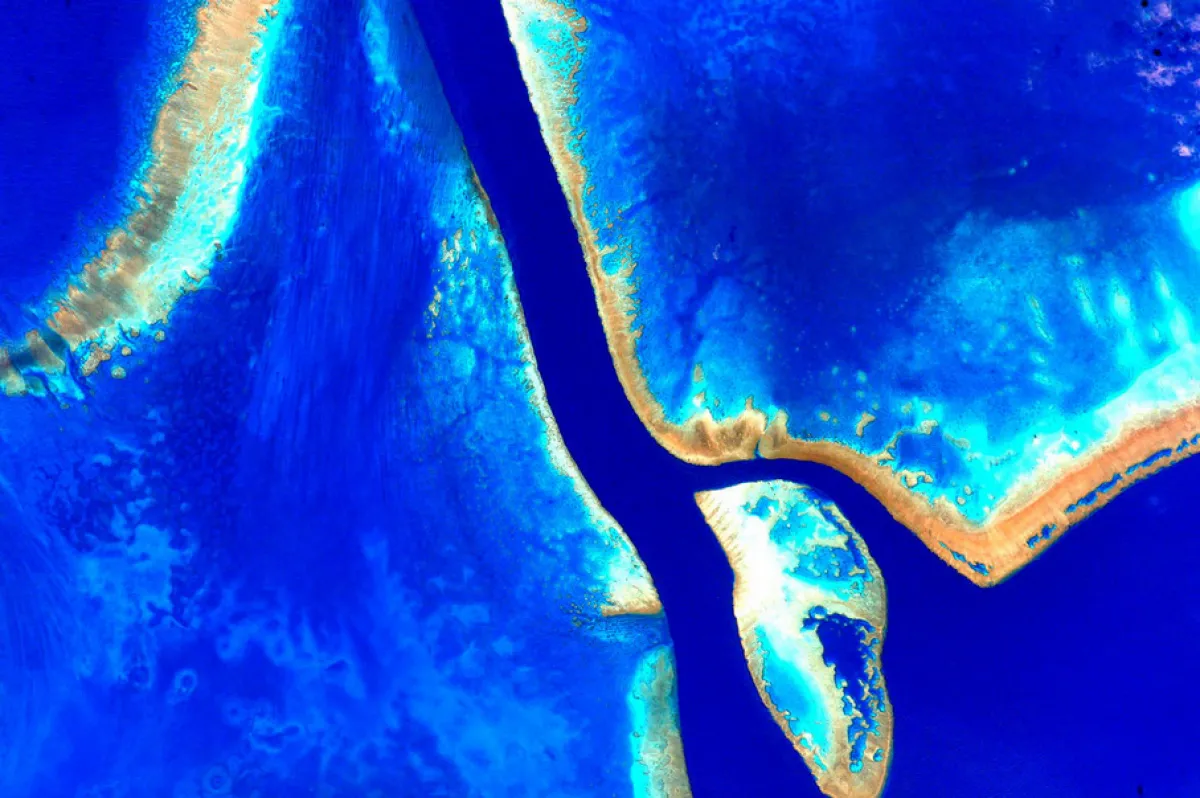
On Oct. 12-13, 2015, NASA astronaut Scott Kelly took a series of seventeen photographs from the International Space Station during a single flyover of Australia. This first photo of the series was posted with the caption, "#EarthArt in one pass over the #Australian continent. Picture 1 of 17. #YearInSpace".